Pat McGowan, Senior Management Consultant
January 6, 2019
Once upon a time, dashboards were considered a premium information technology available only to large organizations that could afford expensive enterprise software suites and had significant IT departments to build and maintain them. In the last few years, however, we have seen the emergence of several software vendors providing more affordable collaborative work management tools that provide dashboard functionality. These tools are cloud based, affordable, and easy to use.
We have all been exposed to dashboards as either business users or purveyors of information technology with the potential to excite executives. Somewhere along the line, dashboards seemed to have more potential than value. We all remember some of the bad experiences, specifically dashboards with the following shortfalls:
- Chalked full of textual and numerical data combinations that mesmerized us
- Displayed strange graphics/charts that didn’t make sense
- Didn’t work properly on mobile devices
- Riddled with clickable items that didn’t open
- Hidden key information nuggets embedded at the bottom of the screen
Most dashboard users can relate to one or more of these mishaps. I will explain what dashboards are and why they are useful to an organization of any size. And while we’re at it, let’s look at a state-of-the art dashboard technology for building dashboards that provide timely information critical to making good decisions for action.
Dashboards can be used to provide critical information to management and business colleagues in order to keep everyone up-to-date on the status and progress of a myriad of projects within an organization. Tracking progress using dashboards in real time keeps the spotlight on the key metrics and allows management to take corrective actions/decisions as appropriate. Furthermore, as we move to a more mobile workforce, it is key that these dashboards can be accessed remotely over the internet on various mobile devices like smartphones or tablets.
The audience for dashboards spans across the complete organization: Human Resources, Finance, Information Technology, Marketing and Sales, Product Development, Projects and Programs, etc. Regardless of the specific business area that you are building a dashboard for, you need to understand who your audience will be. Is your audience team members/colleagues, management, executive, clients or partners? Once you know your audience, you need to determine what is the information they need to consume in order to benefit from this dashboard. Will the audience use this information to make decisions or simply use it to stay in sync with the progress of a particular initiative, campaign or program? Your audience will dictate the requirements of a dashboard.
The next key component is to engage the audience by telling a story which needs to be brief. Think of it as an “elevator pitch”. If the audience needs more data, you can serve that up as a link that they click to get the details. Although visuals are eye candy for the viewer, they need to be appropriate for the situation. When you are trying to show progress over time and possible trends, then bar charts and pie charts are appropriate. The layout of the dashboard is also important as the audience needs to see the key metrics easily at first glance. Humans consume the information top down and left to right so position the key graphics or metrics where they will see it quickly.
There are a number of Collaborative Work Management tools available in the market today that offer dashboard functionality. A report by Forrester (https://www.smartsheet.com/2018-forrester-wave) identifies the top ten dashboard software providers and illustrates how they stack up in the market: Smartsheet, Asana and Wrike lead the pack; Clarizen, Monday.com, Microsoft, ServiceNow, Workfront, and Planview are strong performers; and Airtable is a contender. Smartsheet stands out among its competitors, and according to Forrester, “Smartsheet leads the pack with a balance of features and future strategy.”
My most recent experience has been with the Smartsheet product which I would describe as a “combination of Microsoft Project and Excel on Steroids”. It is fairly easy and intuitive to use, and provides for excellent collaboration. The following dashboard samples were created using Smartsheet’s dashboard/portal software tool.
Sales Tracking
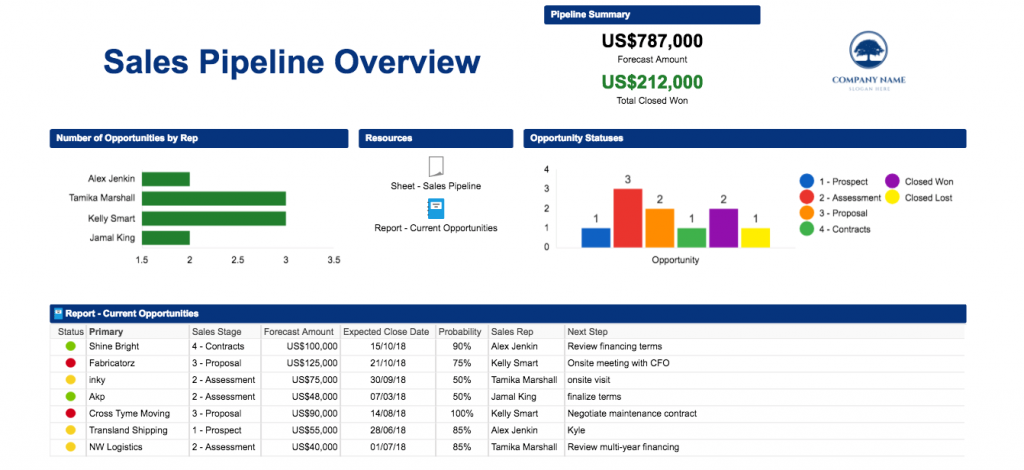
This dashboard illustrates a standard template provided by Smartsheet. The key metrics are identified at the top, while more detail is available at the bottom and via resources that are clickable.
IT Architects Project Status
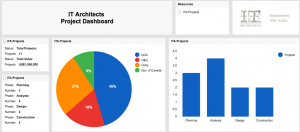
This dashboard provides a summary level status for projects in flight. It is the combination of graphics and summarization that makes this dashboard attractive.
In summary, the critical things to remember when designing your dashboard is:
- Know your audience
- Identify the key metrics
- Tell your story briefly
- Allow for deeper dives into detail
- Avoid busy text and data lists
By keeping these design philosophies in mind, you can ensure that your Dashboards are SMART!
Pat McGowan is a Principal at Gilmore & Associates Inc. in Calgary. Pat’s I.T. career spans a period of over 39 years, including decades as an IT services consultant. Pat’s clients have included Panasonic, Petro Canada, TransAlta, Manitoba Hydro, ATB, Shaw, and FortisAlberta.
Mr. Pat McGowan of ICOM is a Senior Management Consultant affiliated with IT Architects in Calgary, Alberta, and specializing in Program and Project Management for Information Technology solution delivery. Pat has held management positions and consulted with DMR, IBM, TELUS, Bell Canada, and The Government of Alberta. He has expertise and experience in SCADA, Contact Centre Telephony, IT Infrastructure, Outsourcing and Vendor Management. Pat has industry experience with Utilities, Telecommunications, Oil & Gas, Finance, Government, Transportation, and Manufacturing.
IT Architects (www.itarchitects.ca) is an information consulting firm specializing in business process optimization, system evolution planning, and the deployment of leading-edge technologies. If you require further information, Pat can be reached at info@itarchitects.ca or 403-404-8650.


